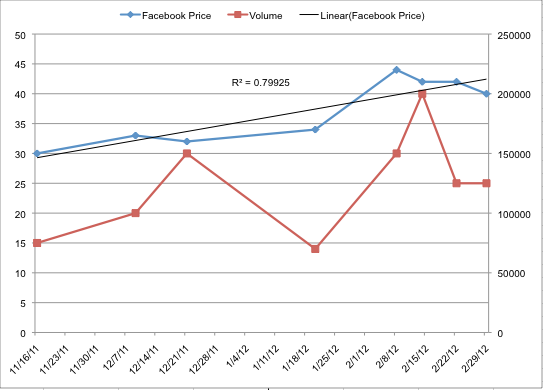
Digging through my email I realized that I had quite abit of email related to sales of Facebook Class B shares on the secondary market. I dug around the emails that I saved from November 2011 and have eight data points for Facebook sales to date. Here are the results in a handy chart with the obligatory R² for a simple linear regression. I’ll also note that these “shares” are not actually purchases of shares but purchases of an investment vehicle designed to hold shares of Facebook via an indirect interest.

Facebook Share Sales Data
Detailed Facebook share transaction dates proces and volume that I have collected:
| Date | Price | Volume |
|---|---|---|
| November 16, 2011 | $30.00 | 75,000 |
| December 9, 2011 | $33.00 | 100,000 |
| December 21, 2011 | $32.00 | 150,000 |
| January 20, 2012 | $34.00 | 70,000 |
| February 8, 2012 | $44.00 | 150,000 |
| February 14, 2012 | $42.00 | 200,000 |
| February 22, 2012 | $42.00 | 125,000 |
| February 29, 2012 | $40.00 | 125,000 |
